
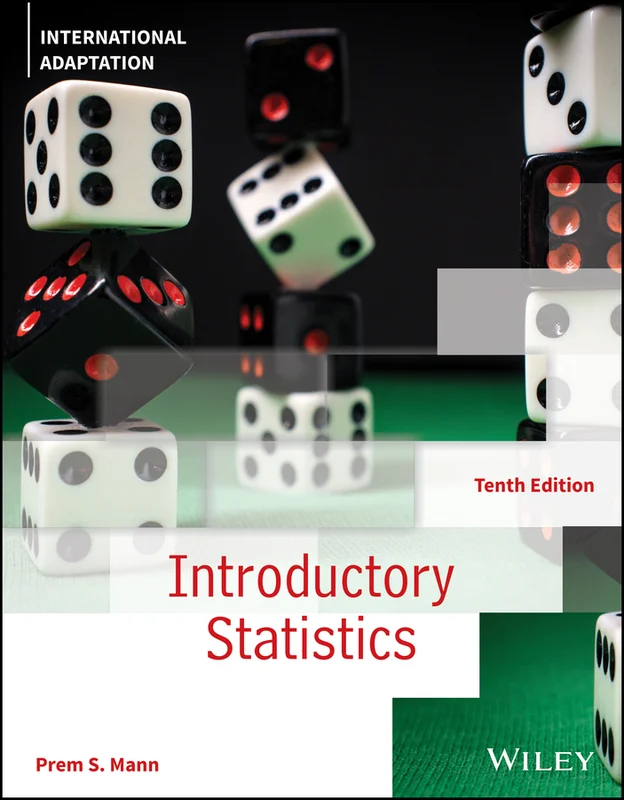
Description
By (author) Mann Prem S.
:
Introductory Statistics, 10th edition, is written for a one- or two-semester first course in applied statistics and is intended for students who do not have a strong background in mathematics. The only prerequisite is knowledge of elementary algebra. Known for its realistic examples and exercises, clarity and brevity of presentation, and soundness of pedagogical approach, the book encourages statistical interpretation and literacy regardless of student background. The book employs a clear and straightforward writing style and uses abundant visuals and figures, which reinforce key concepts and relate new ideas to prior sections for a smooth transition between topics.
This international edition offers new and updated materials and focuses on strengthening the coverage by including new sections on types of scales, negative binomial distribution, and two-way analysis of variance. Additionally, discussions on ogive curves, geometric mean, and harmonic mean have also been added. Many examples and exercises throughout the book are new or revised, providing varied ways for students to practice statistical concepts.
Table of contents:
1 Introduction 1
1.1 Statistics and Types of Statistics 1
Case Study 1.1 Deaths Due to Red-Light Running in the United States 3
Case Study 1.2 Is Anxiety and Depression a Major Problem Among Teens? 4
1.2 Basic Terms 5
1.3 Types of Variables 7
1.4 Types of Scales 10
1.5 Cross-Section Versus Time-Series Data 12
1.6 Population Versus Sample 13
1.7 Design of Experiments 22
1.8 Summation Notation 26
Uses and Misuses of Statistics / Glossary / Exercises / Self-Review Test / Mini-Project / Decide for ourself / Chapter 1 Technology Instructions
2 Organizing and Graphing Data 41
2.1 Organizing and Graphing Qualitative Data 42
Case Study 2.1 Confidence in Charitable and Nongovernmental Organizations 46
Case Study 2.2 Single-Payer Health-Care System Where the Federal Government Provides Coverage for Everyone 47
2.2 Organizing and Graphing Quantitative Data 48
Case Study 2.3 Average Starting Salaries of Teachers in the United States 53
Case Study 2.4 Mom, I Am Hungry 54
Case Study 2.5 How Many Cups of Coffee Do You Drink a Day? 58
2.3 Stem-and-Leaf Displays 66
2.4 Dotplots 71
Uses and Misuses of Statistics / Glossary / Exercises / Self-Review Test / Mini-Projects / Decide for Yourself / Chapter 2 Technology Instructions
3 Numerical Descriptive Measures 87
3.1 Measures of Center for Ungrouped Data 88
Case Study 3.1 Coffee Consumption Statistics 91
Case Study 3.2 Median Prices of Homes in Selected Metro Areas of the United States 94
3.2 Measures of Dispersion for Ungrouped Data 103
3.3 Mean, Variance, and Standard Deviation for Grouped Data 111
3.4 Use of Standard Deviation 117
Case Study 3.3 Does Spread Mean the Same as Variability and Dispersion? 121
3.5 Measures of Position 122
3.6 Box-and-Whisker Plot 127
Uses and Misuses of Statistics / Glossary / Exercises / Appendix 3.1 / Self-Review Test / Mini-Projects /
Decide for Yourself / Chapter 3 Technology Instructions
4 Probability 147
4.1 Experiment, Outcome, and Sample Space 148
4.2 Calculating Probability 153
4.3 Marginal Probability, Conditional Probability, and Related Probability Concepts 160
Case Study 4.1 Vegetarians, Gender, and Ideology 163
4.4 Intersection of Events and the Multiplication Rule 171
4.5 Union of Events and the Addition Rule 177
4.6 Counting Rule, Factorials, Combinations, and Permutations 184
Case Study 4.2 Probability of Winning a Mega Millions Lottery Jackpot 189
Uses and Misuses of Statistics / Glossary / Exerc



Reviews
There are no reviews yet.